[6710782.021013] java invoked oom-killer: gfp_mask=0xd0, order=0, oom_adj=0, oom_scoe_adj=0
[6710782.070639] [<ffffffff81118898>] ? oom_kill_process+0x68/0x140
[6710782.257588] Task in /LXC011175068174 killed as a result of limit of /LXC011175068174
[6710784.698347] Memory cgroup out of memory: Kill process 215701 (java) score 854 or sacrifice child
[6710784.707978] Killed process 215701, UID 679, (java) total-vm:11017300kB, anon-rss:7152432kB, file-rss:1232kB
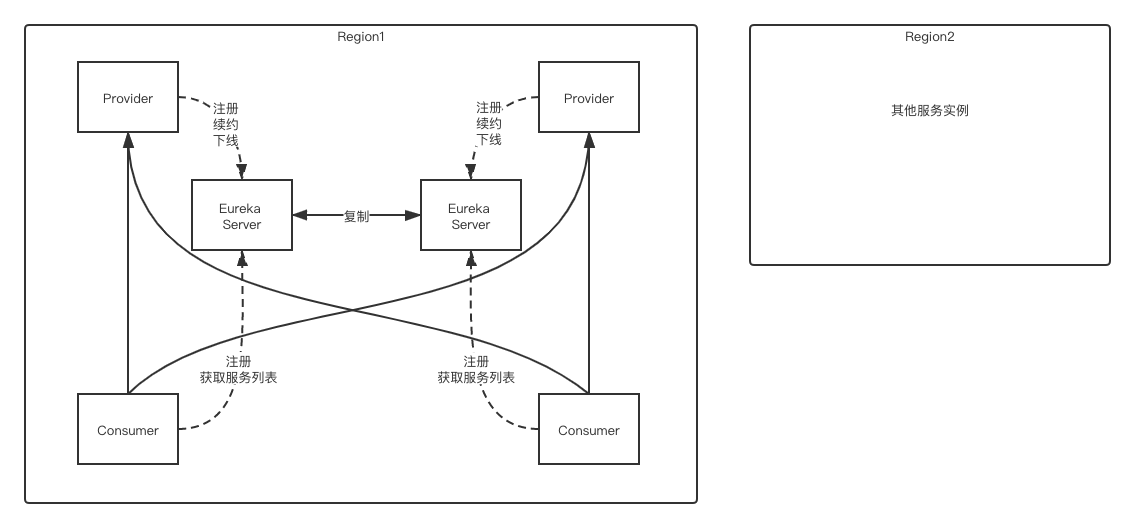
分区:每个 Region 有一个 Eureka 集群用于处理该区域服务失败的情况,各 Region 之间是不会互相通信的。
服务注册到 Eureka Server 后每 30 秒发送一次心跳(heartbeats)来刷新租约(lease),如果网络出现分区或者 Eureka 宕机了,这种心跳自然会停止,如果达到了Renews threshold(即 Server 期望在每分钟中收到的心跳次数,需要考虑是否禁用服务器的自注册、Server/Client 数量等,暂时取默认值 85%就好),Eureka Server 就会将其从服务注册表中移除。
服务注册信息会自动同步到整个 Eureka Server 集群,这也意味着它们是对等的 P2P 集群。
Eureka clients fetches the registry information from the server and csort_bufferhes it locally. After that, the clients use that information to find other services. This information is updated periodically (every 30 seconds) by getting the delta updates between the last fetch cycle and the current one. The delta information is held longer (for about 3 mins) in the server, hence the delta fetches may return the same instances again. The Eureka client automatically handles the duplicate information.
After getting the deltas, Eureka client reconciles the information with the server by comparing the instance counts returned by the server and if the information does not match for some reason, the whole registry information is fetched again. Eureka server caches the compressed payload of the deltas, whole registry and also per application as well as the uncompressed information of the same. The payload also supports both JSON/XML formats. Eureka client gets the information in compressed JSON format using jersey apache client.
Cancel
Eureka client sends a cancel request to Eureka server on shutdown. This removes the instance from the server’s instance registry thereby effectively taking the instance out of traffic.
This is done when the Eureka client shuts down and the application should make sure to call the following during its shutdown. DiscoveryManager.getInstance().shutdownComponent()
Time Lag
All operations from Eureka client may take some time to reflect in the Eureka servers and subsequently in other Eureka clients. This is because of the caching of the payload on the eureka server which is refreshed periodically to reflect new information. Eureka clients also fetch deltas periodically. Hence, it may take up to 2 mins for changes to propagate to all Eureka clients.
孤儿 Server:当发生网络分区,一些 Eureka Server 可能会成为orphaned server,一些 Client 会注册到这些 Server 上,导致一些 Client 能看到这些注册信息而其他的一些则不能。 当网络恢复后,Server 的 P2P 集群能正常地交互,注册信息会被自动同步到所有 Server 上。
异常情况
比如在测试环境中出现:
1
EMERGENCY! EUREKA MAY BE INCORRECTLY CLAIMING INSTANCES ARE UP WHEN THEY'RE NOT. RENEWALS ARE LESSER THAN THRESHOLD AND HENCE THE INSTANCES ARE NOT BEING EXPIRED JUST TO BE SAFE.
To dynamically do this, you will need to first provide your own custom implementation of the EurekaInstanceConfig interface. You can then overload the public Map<String, String> getMetadataMap() method to return a metadata map that contains the desired metadata values. See PropertiesInstanceConfig for an example implementation that provides the configuration based system above.
Inbound Filters execute before routing to the origin and can be used for things like authentication, dynamic routing, rate limiting, DDoS protection, metrics and decorating the request.
Endpoint Filters can be used to return static responses, otherwise the built-in ProxyEndpoint filter will route the request to the origin.
Outbound Filters execute after getting the response from the origin and can be used for metrics, decorating the response to the user or adding custom headers.
Type: most often defines the stage during the routing flow when the Filter will be applied (although it can be any custom string) Async: define if the filter is sync or async, generally meaning do you need to make an external call or just doing work on-box Execution Order: applied within the Type, defines the order of execution across multiple Filters Criteria: the conditions required in order for the Filter to be executed Action: the action to be executed if the Criteria is met
WeightedResponseTimeRule 每个 Server 会根据其平均响应时间计算出一个权重,响应时间越长、比重越小,该 Rule 选择 Server 时会根据该权重来计算概率。
Ping
a component running in background to ensure liveness of servers
ServerList
this can be static or dynamic. If it is dynamic (as used by DynamicServerListLoadBalancer), a background thread will refresh and filter the list at certain interval
静态的 Server 列表 可以在程序里写一个静态列表,将该列表设置到BaseLoadBalancer.setServerList()中。
ConfigurationBasedServerList 默认的 ServerList 实现,可以通过 Archaius ConfigurationManager来设置 Server 列表。
myClient.ribbon.NIWSServerListClassName=com.netflix.niws.loadbalancer.DiscoveryEnabledNIWSServerList
# the server must register itself with Eureka server with VipAddress "myservice"
myClient.ribbon.DeploymentContextBasedVipAddresses=myservice
myClient.ribbon.NIWSServerListClassName=com.netflix.niws.loadbalancer.DiscoveryEnabledNIWSServerList
# the server must register itself with Eureka server with VipAddress "myservice"
myClient.ribbon.DeploymentContextBasedVipAddresses=myservice
myClient.ribbon.NIWSServerListFilterClassName=com.netflix.loadbalancer.ServerListSubsetFilter
# only show client 5 servers. default is 20.
myClient.ribbon.ServerListSubsetFilter.size=5
源码
com.netflix.loadbalancer.DynamicServerListLoadBalancer#updateListOfServers com.netflix.loadbalancer.ServerList#getUpdatedListOfServers com.netflix.niws.loadbalancer.DiscoveryEnabledNIWSServerList#obtainServersViaDiscovery TODO
Kubernetes Master 主要负责管理集群,它会协调集群内的所有活动,包括:scheduling applications, maintaining applications’ desired state, scaling applications, and rolling out new updates。 Master 实际上是三个进程的集合,它们运行在集群的一个 Master Node 上,这三个进程包括:
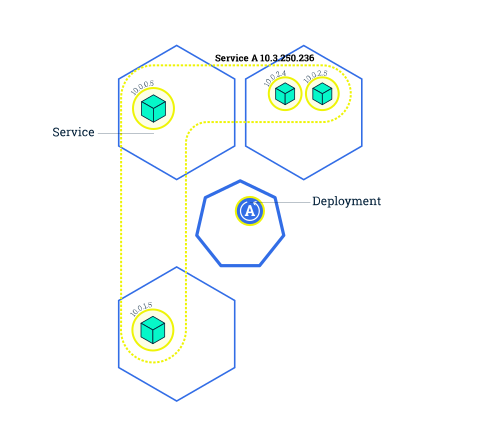
Service 定义了 Pod 的逻辑集合及其访问规则,虽然每个 Pod 都有一个唯一的 IP 地址(Cluster 范围内),但是如果没有 Service 的话这些 IP 也是没法暴露到 Cluster 外的,可以通过指定 ServiceSpec 中的type来指定暴露服务的方式:
ClusterIP (default) - Exposes the Service on an internal IP in the cluster. This type makes the Service only reachable from within the cluster.
NodePort - Exposes the Service on the same port of each selected Node in the cluster using NAT. Makes a Service accessible from outside the cluster using <NodeIP>:<NodePort>. Superset of ClusterIP.
LoadBalancer - Creates an external load balancer in the current cloud (if supported) and assigns a fixed, external IP to the Service. Superset of NodePort.
ExternalName - Exposes the Service using an arbitrary name (specified by externalName in the spec) by returning a CNAME record with the name. No proxy is used. This type requires v1.7 or higher of kube-dns.